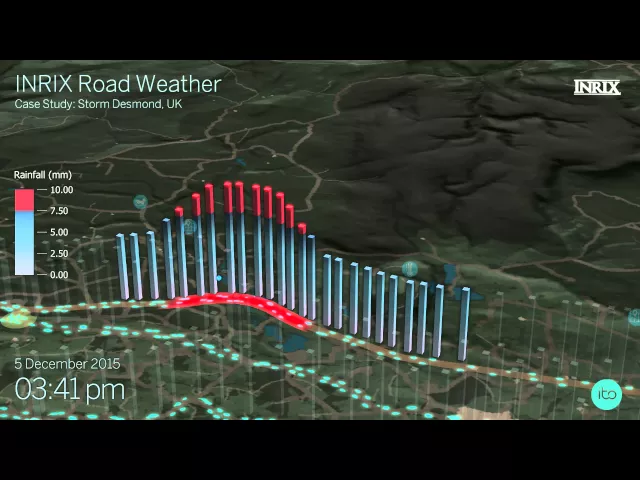
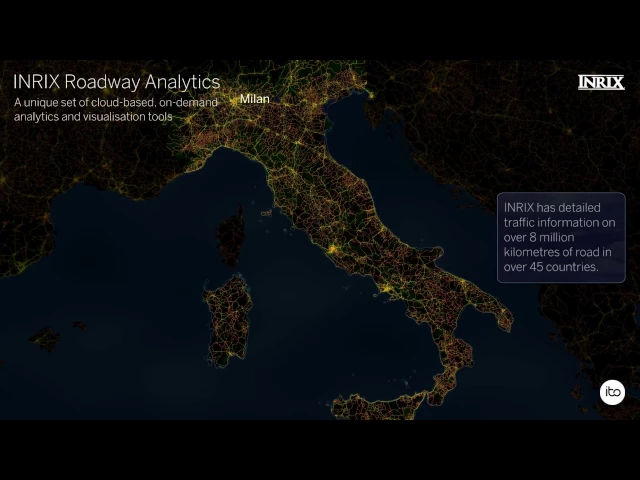
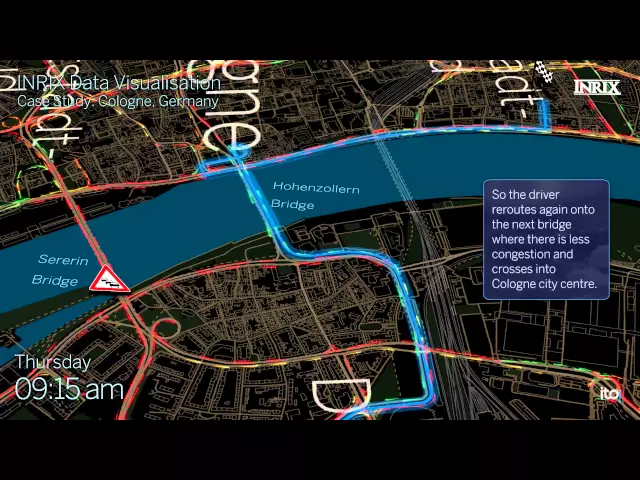
From data to narrative, I created engaging geospatial visualizations for Inrix’s product launches and keynote speeches.
Company
Ito World
Role
Data Visualisation Designer
For Inrix, I created geospatial data visualizations that elevated product releases and keynote speeches. Trusted across 8+ projects over two years, I collaborated closely with the client—analyzing data, crafting storyboards, inventing new visualization methods, and iterating multiple times to deliver stage‑ready outputs that combined clarity with visual impact.
For Inrix, I created geospatial data visualizations that elevated product releases and keynote speeches. Trusted across 8+ projects over two years, I collaborated closely with the client—analyzing data, crafting storyboards, inventing new visualization methods, and iterating multiple times to deliver stage‑ready outputs that combined clarity with visual impact.